 By Jason Boone
Last year felt momentous in the Bend real estate market. Sales were brisk for the majority of 2015, and with all the development around town, there was a certain palpable energy.
But where 2015 actually fit in the greater context of previous years is another matter. The Skjersaa Group has compiled its Annual Market Study for 2015 to give us a broader look at the data, and the study offers some interesting points regarding single-family homes.
Some quick takes from the report:
- It was not our imagination: 2015 was indeed among the best of the 11 years (2005-2015) tracked by the study in terms of the number of sales of single-family homes, median price, and average days on market.
- The study shows that while some speculate that we might be in another housing bubble, there are some significant differences between 2015 and the pre-recession bubble years of 2005-07.
- The data broken down by neighborhood might come as surprise to some. For example, Bend’s Northeast, and not the Northwest or Southwest, experienced the most home sales.
So let’s get to some of the important data.
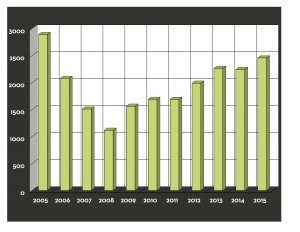
Start with two facts for the entire market. With 2,459 single-family homes sold in 2015, housing inventory moved at the fastest pace since 2005, when 2,893 homes were sold. And the 2015 median price — the midpoint in which half the homes in Bend sold for more and half for less — came in at $329,900. That is significantly less than in 2006 and 2007, when the median price rose to $352,500 and $345,065, respectively.
Total sales
Median price
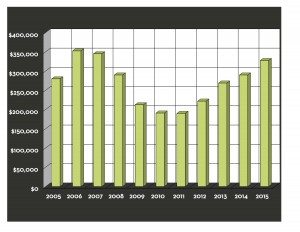
But despite the rising median price, 2015 offered some key differences from 2006. That year, the median price was actually higher than the median list price ($350,340), suggesting a net bidding war across the city. But in 2015, homes sold for less than the $329,900 median list price, which is historically normal and suggests that buyers still have some bargaining power.
The median price in 2015 also seems to have more to do with supply rather than an unsustainable fervor. For one, 2015 saw an average of 491 active listings per month, which is roughly in line with the post-recession years. By contrast, 2007 saw an average of 1,377 active listing per month. And the shorter supply could be seen with the average days on market: 115 days, which is the second-lowest year in the 11 years tracked in the report and fewer than in 2005 (120 days), 2006 (132), and 2007 (169).
Also, the report offers some interesting data separated by neighborhood. Here is a look at 2014 and 2015:
2014
| NW | SW | NE | SE | |
| # of Sales | 589 | 423 | 668 | 551 |
| Median List Price | $449,900 | $332,900 | $244,924 | $259,995 |
| Median Sales Price | $445,000 | $330,000 | $241,444 | $260,547 |
| % Change vs. 2013 | 5.7% | 11.86% | 15.28% | 10.88% |
| Highest Sales Price | $1.6M | $2.05M | $1.21M | $260,547 |
| Avg. Days on Market | 123 | 107 | 122 | 112 |
2015
| NW | SW | NE | SE | |
| # of Sales | 671 | 404 | 714 | 657 |
| Median List Price | $499,000 | $379,000 | $272,500 | $289,900 |
| Median Sales Price | $490,000 | $375,000 | $272,250 | $289,000 |
| % Change vs. 2013 | 10.11% | 13.64% | 12.76% | 10.92% |
| Highest Sales Price | $1.85M | $1.9M | $2.1M | $673,000 |
| Avg. Days on Market | 116 | 111 | 103 | 129 |
Source: Skjersaa Group Annual Market Study
For the second consecutive year, Northeast Bend moved the most single-family homes, followed by the Northwest, Southeast and Southwest. But that is likely, in part, a result of price. The Northeast’s median price was also the lowest of the quadrants.
Of course, that is just part of the story. There is much more data inside the Annual Market Study.
Knowing how the data applies to each buyer or seller takes expertise. I can help navigate the market and find the perfect Bend, Oregon home.
To learn more about Bend home prices, get started with listing your Bend home, or to view area homes contact me call (541) 383-1426, or visit Bend Property Search to connect with me through my website.